Reading a Market
How to read Polymarket and Kalshi market pages to understand trading activity and compare prices for the same event.
A prediction market page can help you follow trading around an event you care about. You might open Polymarket or Kalshi after a news release to see whether the odds have moved and how much trading accompanied the change. To relate the two, the price chart and volume figure need to describe the same contract over the same period.
Suppose a page shows several Bitcoin price targets for Friday. Heavy trading in one target can account for most of the page's total volume, while another target has barely traded. A large lifetime total can also remain on the page after trading slows. Reading each number in context starts with the particular question being traded and what would make it resolve Yes.
How do you read a prediction market?
Start with the exact question the contract settles, then connect the displayed odds to that question. Read the activity figures and chart for the same contract and period, and distinguish the deadline for the event from the end of trading.
Each part of a Polymarket or Kalshi page answers a different question.
| Part of the page | Question it answers |
|---|---|
| Contract question and rules | What must happen for the contract to resolve Yes? |
| Selected outcome and price | Which claim is being priced, and what kind of price is displayed? |
| Order book and order-panel prices | What prices and quantities are available to buy or sell? |
| Trading volume | How much trading happened during the stated period? |
| Open interest | How much remains in outstanding contracts? |
| Price chart | How did the recorded price change over time? |
| Price-change badge | How far has the price moved, and over what period? The change calculation determines whether the number means points or a relative percentage. |
| Dates and status | When can the outcome be decided, when does trading end, and has settlement finished? |
The rules make the question specific enough to settle. Polymarket's resolution documentation says those rules identify the source used to decide the result, the relevant end date, and the treatment of ambiguous cases. Kalshi's market rules summary likewise identifies the conditions for Yes and the source used to verify them.
Consider a hypothetical contract asking whether Bitcoin will be above $100,000 on Friday. Its rules might specify the BTC-USD price on Coinbase at 4 p.m. New York time on a particular Friday. Under a strict “above” condition, a reading of exactly $100,000 fails. A rise above the threshold earlier that morning also fails if Bitcoin has fallen below it by the specified time. The short title leaves details that the rules have to supply.
The hypothetical Bitcoin contract uses Coinbase's BTC-USD price at 4 p.m. New York time on Friday and requires it to be strictly above $100,000. At that time, $100,400 resolves Yes and exactly $100,000 resolves No, while the $99,450 reading resolves No despite the earlier $100,250 price.
An event can contain multiple markets, each with its own Yes and No outcome. A Bitcoin event might contain separate markets for several price thresholds, while a championship event might contain one market for each team.
An event's volume can combine trading across all its markets. Heavy trading in the $100,000 threshold could dominate a Bitcoin event's total even if the selected $120,000 contract has barely traded.
The $1.7 million headline volume combines all four markets in this hypothetical Bitcoin event. Of that total, $1.1 million comes from the $100,000 threshold, while the selected $120,000 market accounts for $30,000, or about 1.7%.
Why can one prediction market have several prices?
Current offers show what buyers and sellers are willing to trade at, while the last-trade price records a completed transaction. The headline percentage may use the last trade or a midpoint between the current offers, so it can differ from the price available for a new trade.
Under Polymarket's documented display rule, the percentage normally uses the midpoint of the best bid and ask, switching to the last trade when their gap exceeds ten cents.
For a standard Yes contract worth $1 if the condition happens and zero otherwise, 63¢ corresponds to an implied probability of about 63%. That percentage concerns the condition written in the contract, including its deadline and source.
In a hypothetical Yes market, these figures could appear together:
| Figure | Price | What it records |
|---|---|---|
| Best bid | 61¢ | The highest price someone currently offers to pay. |
| Best ask | 65¢ | The lowest price someone currently offers to sell for. |
| Midpoint | 63¢ | The average of the best bid and best ask. |
| Last trade | 62¢ | The price of the most recent completed transaction. |
A displayed 63% can sit between the prices available for an immediate purchase or sale. In this example, buying starts at 65¢ and selling starts at 61¢. The order book's available quantities also affect the price you pay. An order larger than the amount at the best quote can reach other prices.
Polymarket displays the 63¢ midpoint as 63% for this hypothetical Yes contract. Buying starts at the 65¢ ask and selling at the 61¢ bid, while the last completed trade was at 62¢.
Kalshi's probability explainer relates the Yes price to an implied chance without specifying which price its headline percentage uses. Comparing the chance figure with the Yes buy price and the current bid and ask shows where it sits among those prices.
Every displayed price also belongs to a particular observation time. Suppose a company reports earnings at noon. A last trade at 11:50 a.m. predates the announcement, even if the page displays it when you reload at 12:10 p.m. Quotes posted at 12:05 p.m. give a later observation to compare with the news.
On this hypothetical earnings day, a market page reloaded at 12:10 p.m. still shows the 11:50 a.m. trade price. That trade precedes the noon earnings report, while the 12:05 p.m. quotes follow it.
What does volume mean on Kalshi?
Kalshi counts contracts traded during a period and reports event-contract volume at their $1 face value, according to a company statement defending its volume reporting. On a Polymarket market page, the volume total has a dollar sign, but its public data definitions specify separate totals in shares and leave the calculation used on the page unstated.
Suppose one trader sells 500 existing Yes contracts at 48¢ each to another trader, excluding fees. The same transaction has three useful measurements:
| Measurement | Amount | What it means |
|---|---|---|
| Contracts traded | 500 | The number of Yes contracts transferred. |
| Purchase payment | $240 | The cash the buyer paid at the agreed price. |
| Settlement notional | $500 | The contracts' combined face value, using $1 per successful contract. |
Notional is the face value used to measure the size of a trade. Under Kalshi's convention, this trade contributes $500 of volume, even though the buyer paid $240. A total based on purchase payments would count the smaller amount.
Polymarket's documented event live volume counts shares on the side accepting an available order, called the taker side. Under this one-sided measure, the example contributes 500 shares. Adding the buyer's and seller's activity would give 1,000 shares across the two participants. Its trader leaderboard uses two-sided share volume, so adding traders' totals can produce a different number from a market's one-sided total.
The period can change the reading just as much as the unit. Lifetime volume keeps accumulating, so a market can retain a large total after activity has slowed. A market that traded 100,000 contracts since listing but only 200 in the past day has done nearly all its trading earlier.
A rolling 24-hour figure can fall even as new trades occur, because older trades drop out of the window. Suppose 1,000 contracts traded yesterday morning leave that window while 300 trade this morning. The displayed volume falls by 700 contracts despite the new trading. A calendar-day total starts from the beginning of the day in its stated timezone. At noon, that figure covers only the hours since midnight, while a rolling 24-hour figure also counts the previous afternoon and evening.
Between 6 a.m. and 10 a.m., the hypothetical market's rolling 24-hour volume falls from 1,400 contracts to 700. The later window excludes yesterday morning's 1,000 contracts and adds this morning's 300, with 400 counted in both windows.
What does open interest mean on Polymarket?
Polymarket open interest measures the money backing positions that remain outstanding at a particular time. Its analytics definitions express this collateral in dollars. Kalshi reports a contract count, counting each Yes/No pair once.
Volume records trading during a period. An existing contract can pass through several owners, adding to volume each time without increasing open interest.
Using Kalshi's counting convention, suppose a market begins with 2,000 outstanding Yes/No pairs. A holder sells 500 existing Yes contracts to a new buyer. That transfer adds 500 contracts to trading volume, but open interest remains 2,000 because the buyer takes over an existing position.
New pairs arise when a trader opening a Yes position is matched with someone opening the opposite No position. Creating 100 such pairs raises open interest from 2,000 to 2,100. When holders of opposing positions are both closing, their matched trade retires a pair. Retiring those 100 pairs returns open interest to 2,000. Polymarket's split and merge operations also create complete Yes/No pairs from collateral or exchange complete pairs back for collateral.
In this hypothetical Kalshi market, transferring 500 existing Yes contracts and then creating and retiring 100 Yes/No pairs adds 700 contracts to the day's volume. Open interest stays at 2,000 pairs after the transfer, rises to 2,100 when pairs are created, and returns to 2,000 when they are retired.
Open interest vs volume
For a day with trading activity, compare the amount traded with open interest at the start and end of that day. The same trading volume can accompany different changes in open interest, depending on whether traders opened, transferred, or closed positions:
| Open interest at the end of the day | Trading that can produce it |
|---|---|
| Unchanged | Existing holders sold to new holders, or newly created pairs and retired pairs offset each other. |
| Higher | Traders opening opposing positions created more pairs than closing holders retired. |
| Lower | Holders closing opposing positions retired more pairs than new trades created. |
Each pair contains a Yes claim and a No claim, so rising open interest carries no Yes or No preference. A market with more open interest can have fewer traders if their positions are larger.
A daily volume-to-open-interest ratio compares one day's trading with the positions outstanding at the observation time. Both figures need compatible units, so share volume and collateral dollars need a conversion before they can be compared this way. High volume relative to open interest can result from existing positions changing owners repeatedly.
Liquidity and order-book depth concern the quantity you can buy or sell now and the prices available for it. Holders may keep their positions without offering them for sale, and orders filled yesterday are no longer available. The venue's live orders show what is available to trade today.
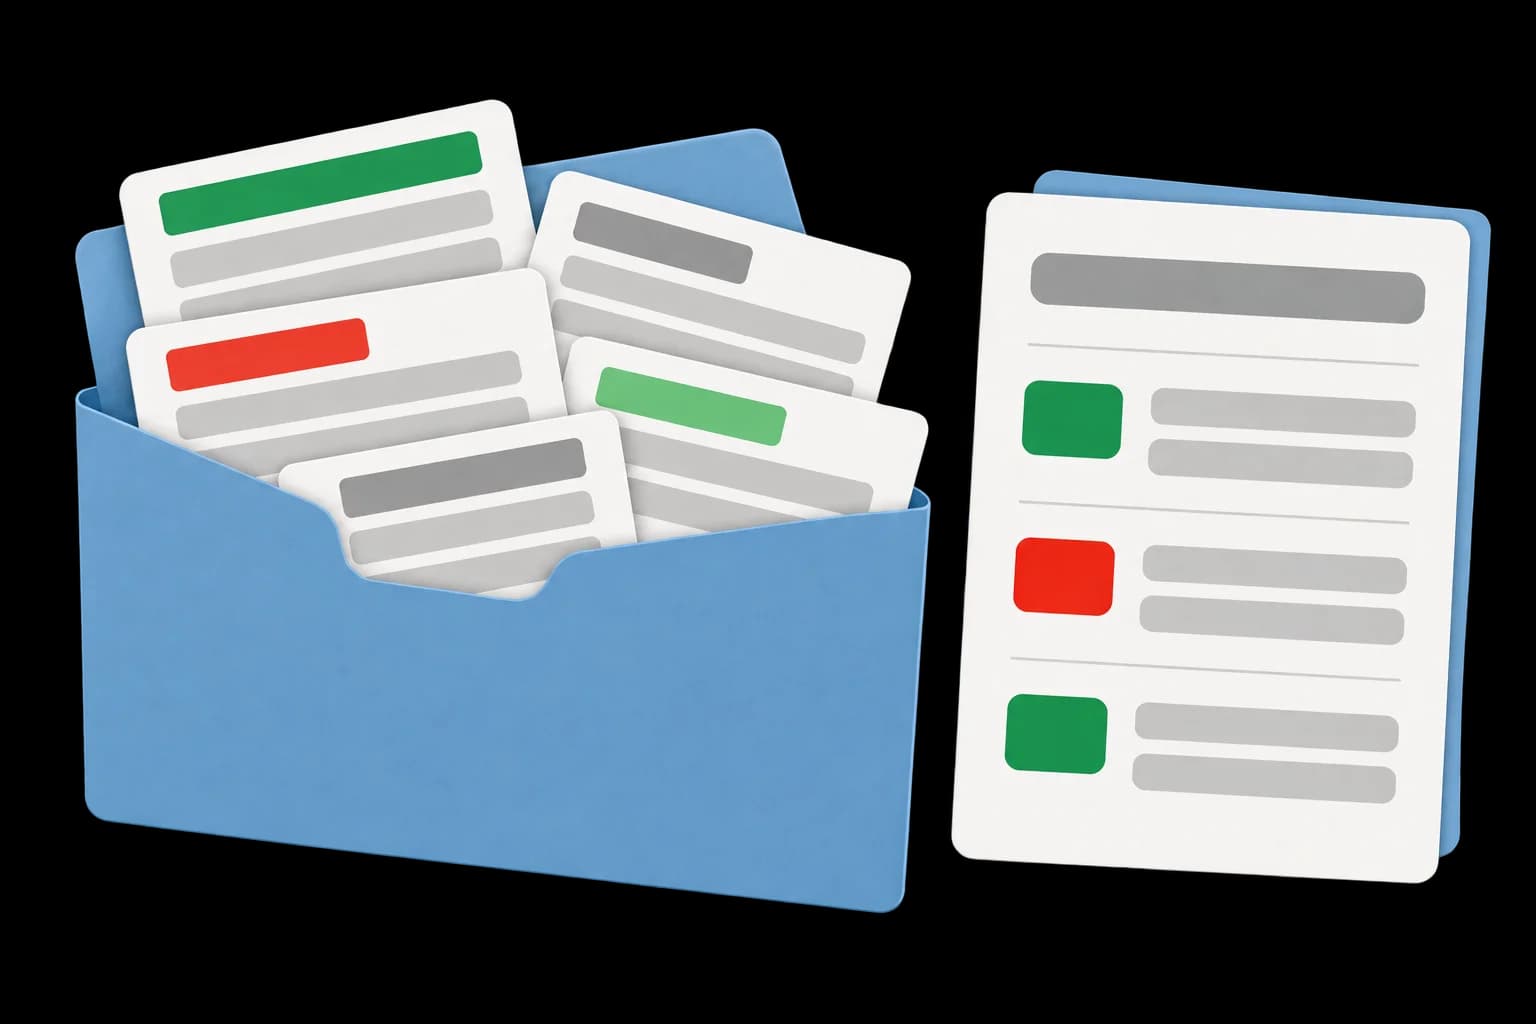
The portfolio represents contracts people hold, while the separate order list contains offers to trade now. Holders can keep contracts without offering them for sale, so open interest alone does not tell you what is available to buy.
Does high volume mean prediction market odds are reliable?
A high-volume market can still be mispriced, because turnover records transactions without telling you whether the traders' information was correct. Recent trades show which prices buyers and sellers agreed to. Assessing prediction market accuracy takes a record of prices compared with the outcomes that followed.
Volume also leaves the number of participants unknown. One large trade can generate the same volume as many smaller ones. A price move accompanied by a volume spike shows more trading during that interval, which could come from a few large traders or many smaller ones.

The transaction record represents trading activity, while the report and pencil represent research into the information behind a market view. A large volume total alone does not establish whether that information supports the price.
Double counting and Polymarket wash trading
Reported volume can overstate activity if a calculation counts the same transaction twice. Paradigm researcher Storm Slivkoff traced inflated totals in third-party Polymarket dashboards to separate blockchain records for the two sides of a trade. Adding those records counted the transaction twice. The analysis carries a disclosure that Paradigm is an investor in Kalshi, a Polymarket competitor.
The buyer's and seller's records each describe the same hypothetical trade of 500 shares. Adding the records produces a 1,000-share total by counting that single transfer twice.
Wash trading involves transactions arranged to create apparent activity without a genuine change in economic exposure. In Network-Based Detection of Wash Trading, Allen Sirolly and coauthors examined Polymarket wallet networks. Their November 2025 working paper classified about a quarter of volume from November 2022 through mid-October 2025 as consistent with wash trading. This was an estimate from trading patterns without definitive evidence identifying which individual transactions were wash trades.
How do you read a prediction market chart?
On a Polymarket chart, first identify which outcome each line follows and whether it records trades or quotes. A No line follows the condition failing, so a rise in its price points in the opposite direction from a rise in the Yes price.
Kalshi Pro documents its standard contract-price line as steps that hold the recorded price between trades. Its crypto view can instead show the underlying asset against a target. An asset chart might show Bitcoin at $98,000 below a $100,000 target. A contract chart for the same subject could show 63¢ for a Yes claim about Bitcoin finishing above that target.
When several lines share a chart, each can follow a different market. On a championship chart, each team's line tracks its chance of winning, and the teams are mutually exclusive outcomes because only one can win. Bitcoin thresholds can overlap instead. A price of $115,000 at the specified time satisfies both “above $100,000” and “above $110,000,” so several Yes contracts can succeed together. Their implied probabilities can add to more than 100%.
In the hypothetical championship, only one team can win, and the four chances sum to 100%. Bitcoin can finish above several thresholds at once, so its four chances sum to 190%.
Candlestick charts and volume bars
A candlestick summarizes an interval's opening and closing prices, with a body joining them and thin lines called wicks reaching the high and low. These four prices are often labeled OHLC, for open, high, low, and close. Under the common green/red convention, a green candle closes above its opening price and a red candle closes below it. The closing price is the last observation in that chart interval.
Each candle's body joins its opening and closing prices, rising from 48¢ to 58¢ in green and falling from 58¢ to 50¢ in red. The wicks mark the full range of each hypothetical interval, from 45¢ to 63¢ for green and 47¢ to 61¢ for red.
The price being summarized can also vary. Kalshi's candlestick data separates Yes bids, Yes asks, and completed trades. An ask-price candle can reach its high even if nobody buys at that price. Polymarket's price-history documentation describes sampled prices without identifying them as trades, quotes, or midpoints.
Volume bars measure how much traded during each interval under the chart's counting convention. A bar of 500 contracts could represent one 500-contract trade or five 100-contract trades, potentially at different prices. The individual trades' prices and sizes show how much traded at each price. A tall bar can accompany a small net price change when substantial trading leaves the closing price close to where it began.
Flat lines and short-lived moves
A flat last-trade line can mean repeated trades at the same price or no new trades at all. Trade timestamps and volume for the interval separate those cases. If the last transaction was an hour ago, an unchanged line carries that hour-old observation forward.
A moving last-trade line can also accompany unchanged quotes. With a best bid of 61¢ and a best ask of 65¢, trades might alternate between 61¢ and 65¢ while the midpoint stays at 63¢. This bid-ask bounce comes from trades occurring on opposite sides of the spread, the gap between the quoted buying and selling prices.
From 10 a.m. to 11 a.m., hypothetical trades take place at the unchanged 61¢ best bid or 65¢ best ask. Switching between those prices moves the last-trade line by 4¢ while the midpoint remains at 63¢.
The chart interval controls how much detail survives. Imagine a contract trading at 48¢, reaching 65¢, and returning to 49¢ within an hour. A line showing only the hourly closing observations leaves out the temporary jump. A candle retaining that hour's high records it, although it still omits the exact sequence of trades. Zooming out can hide a reaction that mattered to someone trading during it.
A brief rise to 65¢ appears in the line recording every trade and in the candle's wick. For the same hypothetical hour, the line of closing observations records only 48¢ at 10 a.m. and 49¢ at 11 a.m.
Percentage points and percent changes
A move from 40% to 50% is a gain of 10 percentage points. Relative to the starting value, it is a 25% increase, because the ten-point gain is one quarter of 40.
Each block represents 10 percentage points, so the rise from 40% to 50% adds one block to the original four. That extra block is a quarter of the starting value, making the same move a 25% increase.
A price-change badge can report either calculation, and its period determines which starting price is used. A daily change can be small even if the contract has moved far from its price at listing. Reporting “40% to 50% over one day” gives both the movement and its timeframe.
Why did the odds change on Polymarket?
Polymarket odds change when trades occur at different prices or when traders change the buy and sell orders available in the book. News can motivate those changes, as can a trader's need to enter or exit a position.
A headline price can move even without a trade. Suppose the best bid is 61¢ and the best ask is 65¢, giving a 63¢ midpoint. If the cheapest seller cancels and the next ask is 69¢, the midpoint rises to 65¢. The last-trade line stays at its previous price because no transaction has occurred.
For this hypothetical market, canceling the 65¢ sell order makes 69¢ the best ask while the best bid stays at 61¢. The displayed midpoint rises from 63¢ to 65¢ without a transaction, leaving the last trade at 62¢.
A large order can instead consume the available contracts at several prices, causing slippage as part of the order trades beyond the best quote. That can move the last trade and leave a different best quote behind. The quantities available at each price determine how far the order has to go to fill.
Time passing can change the chance of meeting a deadline even without a new headline. Suppose a contract asks whether Bitcoin will touch $100,000 by Friday. Bitcoin could remain near $98,000 while the Yes price falls as Friday's deadline approaches, because less time remains for the required rise.
Bitcoin stays near $98,000 in this hypothetical week, below the $100,000 level the contract requires it to touch by Friday. The Yes price falls from 42¢ to 9¢ as the deadline approaches and less time remains to reach that level.
To investigate a move around an announcement, reconstruct the timing:
- Identify when the price changed and how finely the chart records time. An hourly observation may be too coarse to tell whether a move preceded a particular headline.
- Find the original announcement or data release and its publication time. A later article may report something traders could already have read. Individual posts behind a discussion trend can help trace when people were sharing a report on Bluesky.
- Compare the relevant market's trades or quotes before and after that time. Related contracts can show whether the change extended beyond one question.
- Read the new information against the contract's settlement condition. Good news about a company may have little bearing on a contract about a particular product shipping by a deadline.
For example, if a team's price falls after its starting goalkeeper is ruled out, the injury report is a plausible explanation. An earlier injury report or discussion could explain a decline that began before the official announcement. A small reaction afterward would also be consistent with traders already expecting the absence. Posts published after the fall might simply be reacting to the changing price.
After a 1 p.m. injury report, the hypothetical team's Yes price falls from 55¢ to 47¢ before the 5 p.m. announcement. Posts about the goalkeeper peak at 96 in the following hour, while the price falls another 2¢ to 45¢.
When do Kalshi markets close?
Kalshi markets close when the specified outcome occurs or at a listed date and time, as its timeline explanation describes. Polymarket's resolution documentation says trading stops once a market resolves and defines the end date as when it becomes eligible for resolution.
Dates on a market page can refer to different stages:
| Date label | What it describes |
|---|---|
| Event deadline or observation time | When the relevant period ends or the specified measurement is taken. |
| Kalshi market close time | When trading is scheduled to end, subject to the contract's closing conditions. |
| Kalshi expected expiration | When the outcome is expected to be known. |
| Polymarket end date | When the market becomes eligible for resolution. |
Kalshi's expected expiration can precede its scheduled close because the close may be set further in the future to accommodate rescheduling. If early closure is allowed, trading can stop before that scheduled date.
Kalshi can keep a market open after a match while the official source finalizes its data. For a contract about a player's statistics, the match result may be known before the league confirms the statistic used to settle that contract.
Determination or resolution decides the outcome under the rules. Settlement then processes the final payment or makes winning tokens redeemable, so a contract can be closed but still awaiting settlement. Even at a price near 100%, payment waits for the outcome to be confirmed and settlement to finish.
The hypothetical Kalshi market on a player's statistics stays open past Saturday's match and expected expiration, closing when the league confirms the statistic at 10 a.m. Sunday. The outcome is decided at 10:30 a.m. and winning contracts are paid at 1 p.m., before the scheduled close the following Saturday.
How can you tell whether two prediction markets match?
Compare the conditions that would make each contract settle Yes, including the deadline and the source used to verify the result. For a price comparison, also match the type of price and when it was observed.
Contracts found through cross-venue market search can share a subject in their titles or resolution rules while differing on these details:
| Detail | What has to match |
|---|---|
| Outcome | The precise condition for Yes, including whether a threshold is strict or inclusive. |
| Period | The observation time or deadline, including the timezone. |
| Source and measurement | The same exchange, agency, release, or official record, using the same measurement. |
| Exceptional cases | Compatible treatment of cancellation, postponement, missing data, or revisions. |
| Price measure | Comparable quotes or trades, with their observation times. |
Consider two Bitcoin contracts with the same $100,000 threshold. A brief rise on Friday morning followed by a price below $100,000 at 4 p.m. would satisfy a contract about touching the level at any point that day. It would fail a contract asking whether Bitcoin is above that level at 4 p.m.
Bitcoin reaches $100,250 at 10:30 a.m. on this hypothetical Friday, so the contract on touching $100,000 during the day resolves Yes. The contract requiring a price above $100,000 at 4 p.m. resolves No because the reading then is $99,450.
Different settlement conditions can leave a paired Yes and No position with both contracts paying zero. Buying one Yes contract and one No contract would return $1 if both contracts asked the same question. At a combined purchase price of 92¢, that would appear to secure an 8¢ profit before fees.
For the Bitcoin pair, suppose you buy No on the touch contract and Yes on the 4 p.m. contract. Bitcoin briefly reaches $100,000 in the morning and is below it at 4 p.m. The touch condition has happened, so the No holding loses, and the price at 4 p.m. is too low for the Yes holding. Both positions settle at zero, losing the full 92¢ paid for the pair.
No on Bitcoin touching $100,000 and Yes on it being above $100,000 at 4 p.m. cost 92¢ together in this hypothetical example. The apparent 8¢ gain assumes matching questions; a morning touch followed by a 4 p.m. price below $100,000 makes both holdings pay zero, losing all 92¢.
Even with matching rules, a last trade from yesterday and a midpoint after today's announcement are different observations. Comparing the same price measure at comparable times separates those effects from differences between the venues' current prices.
Matching contracts can still trade at different prices on Kalshi and Polymarket because each venue has its own traders and available orders. For a possible purchase, compare the prices available to buy the required quantity on each venue. For a sale, compare the prices available to sell. Those quotes and the costs of trading determine whether a displayed gap could produce a profit.
Order Books
How to read Polymarket and Kalshi order books, including bids, asks, depth, and slippage.
Prices and Probabilities
How to read prediction market odds and translate prices into implied probabilities.
Event Contracts
How settlement conditions, thresholds, and groups of outcomes define a contract.
Market Resolution
How outcomes are confirmed and outstanding positions reach settlement.